This can be an invaluable resource for teaching such complicated topics as:
political ideology...
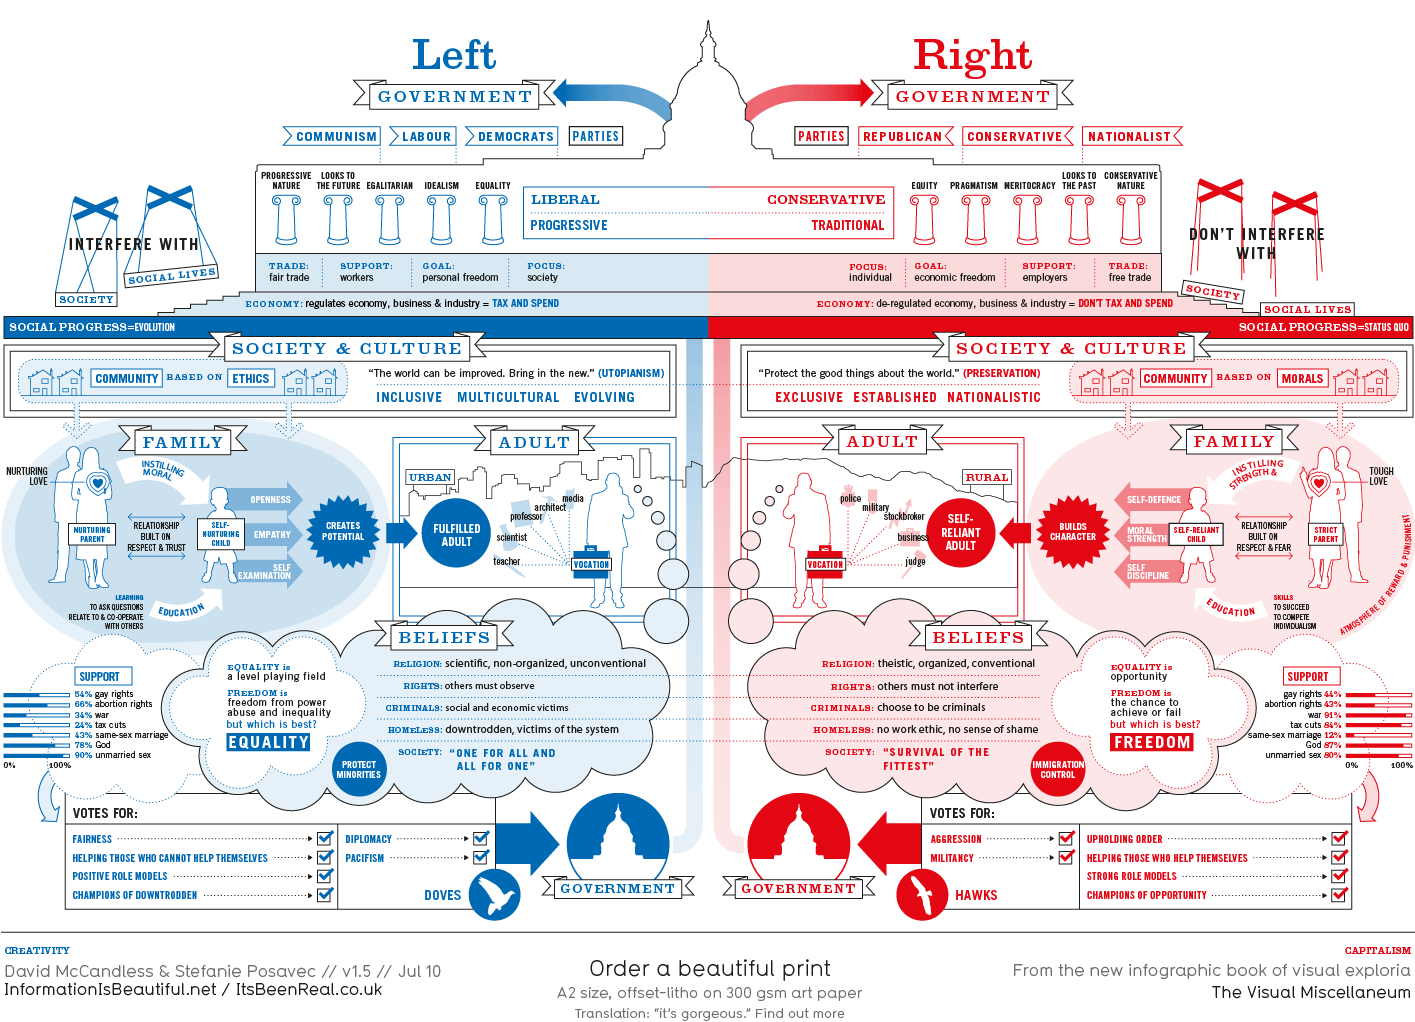
climate change...

global economies...

and so much more.
I've already been able to pull entire lessons out of these graphics, and just having one of these images as my desktop got my students talking when I was transferring from a powerpoint to a website.
I can't think of a more ringing endorsement than the fact that high school students thought it was fun and exciting to talk about global market dynamics and censorship based off a picture they saw in passing.


0 comments:
Post a Comment