Showing posts with label Visualization. Show all posts

Thursday, January 20, 2011

British Library Timelines: Sources from History


If you have ever wished that you could just leap through some of the most important written works in history like the pages of a book, now is your chance!

The British Library has been generous enough to create an interactive, 3d timeline that includes some of the most influential written works in the history of the world, laying them out across time and space, and sortable by topic and category. Not only can students (or teachers) see how these different documents related to each other across time, but from within the timeline you can open up the documents themselves, and see high-res scanned copies of documents such as the Magna Carta, Leonardo Da Vinci's notebooks, the Declaration of Independence, and original Sherlock Holmes manuscripts.

All of these documents that normally are secured in London, at your fingertips and available to your students through the generosity of the British Library.

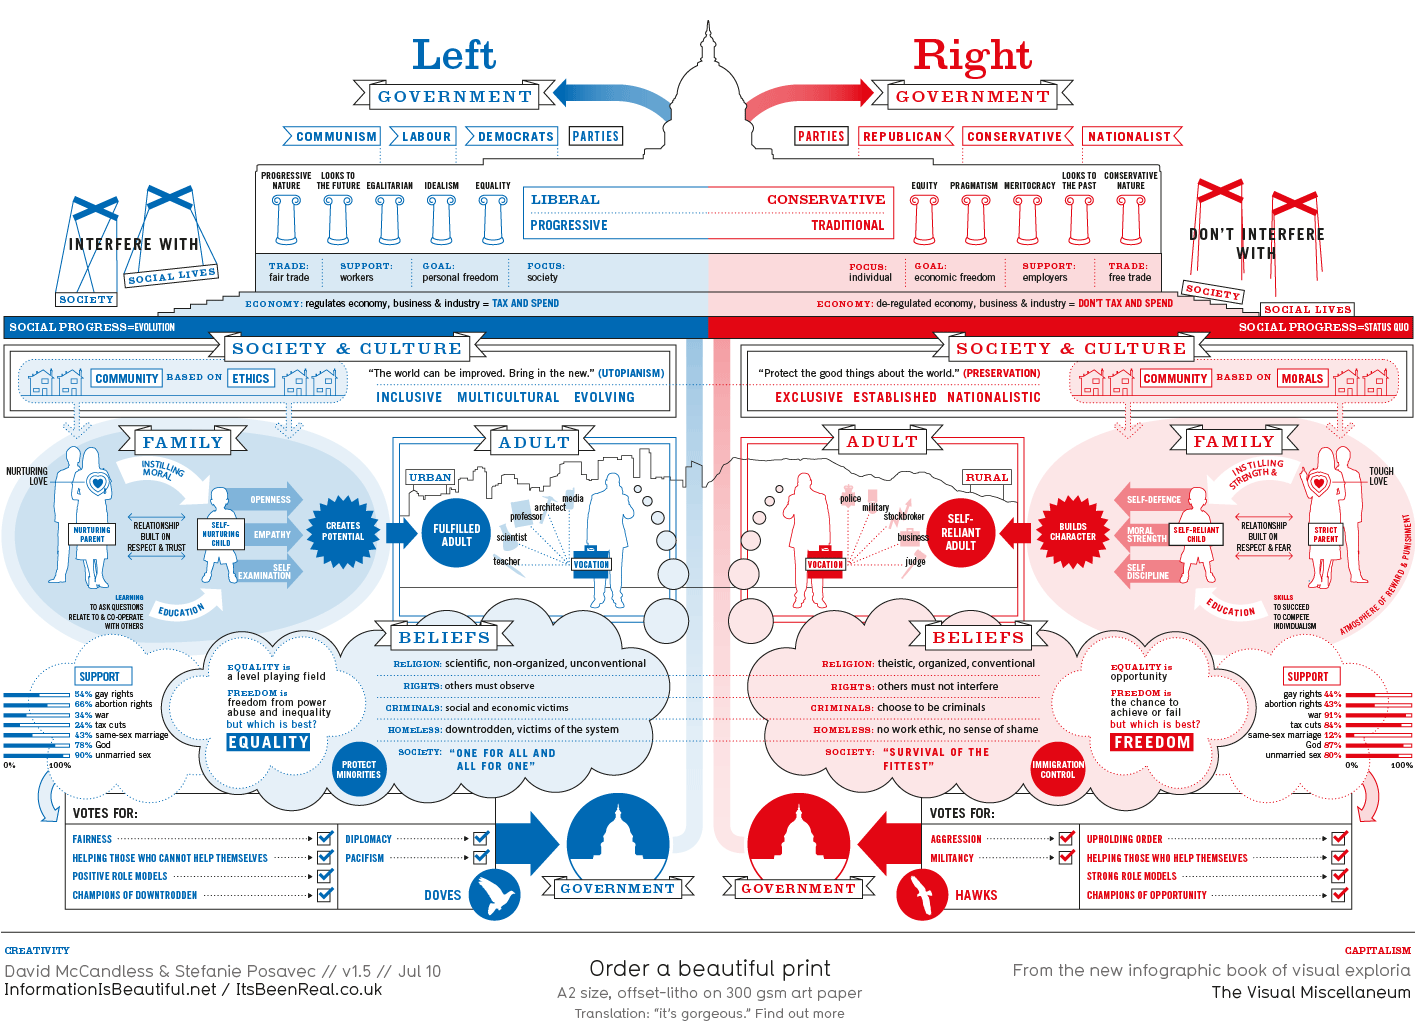
InformationIsBeautiful.net | Visualizing data as an artform

This is without a doubt the best source I have ever found for examining complicated data in easy to understand fashion. If you have been to a bookstore in the past year and seen the book The Visual Miscellaneum, this is the guy who wrote that book!

This can be an invaluable resource for teaching such complicated topics as:

political ideology...

climate change...
global economies... 

and so much more.

I've already been able to pull entire lessons out of these graphics, and just having one of these images as my desktop got my students talking when I was transferring from a powerpoint to a website.

I can't think of a more ringing endorsement than the fact that high school students thought it was fun and exciting to talk about global market dynamics and censorship based off a picture they saw in passing.